Dashboard WebApp
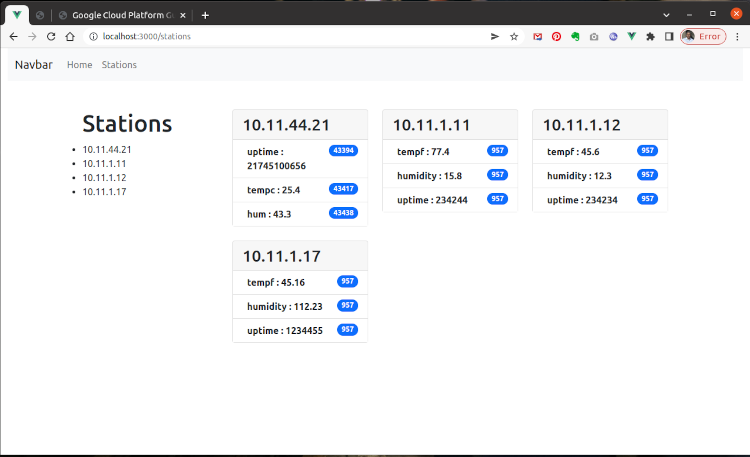
The snapshot of the dashboard above is a WebUI served by the Hub displaying the real time values for temperature, humidity and uptime. Actually three of the four stations in the screen shot above are mocked using mosquitto_pub. See the “Mocking” section of the Hub section of the website.
Recieving Data
The dashboard recieves all of it’s data from the Hub which in turn streams the data to the dashboard over Websockets in real-time.
TODO add historic graphs of data from the REST data API
Historic data is available via the REST API, however as of this writing the dashboard does not yet have the capability to fetch and graph this data. This feature is coming..
Mobile First
A great mobile experience is required to be relevant in the modern world. For this reason the mobile app will be responsive striving to provide an excellent mobile experience.
It is quite obvious that the number of mobile users is huge. To stay relevant today mobile support is a requirement. Ideally, beginning this project as a mobile first design is as modern as it gets!
Written with Vue
React or Vue? That was the question, and Vue was the answer. I wanted to use vuetify but as of this writting it still does not work with Vue 3.0, so I am using Bootstrap 5 at the moment.
Lot’s To Do!
There is a lot of work to do for the dashboard, including but not limited to the following tasks:
- Build the mobile version of the application
- REST API call to graph historical time-series data
- Single Page Station View
- Make it much sexier!
Want to get involved? Join the Newsletter and say Hi!